NFL Playoff Prediction Model
Overview
Developing a prediction model hinges greatly on the statistics that are chosen to influence the model. With so many statistics to choose from, it quickly became clear how many different statistical combinations there were, and how each combination can yield a different result. From building a database of statistics to developing and testing the model, this project was a great way to dive into data manipulation and machine learning.
Obtaining the Data
A database of stats was developed by using 4 websites, linked below. The database consisted of over 20 stats, that each contains weekly regular-season values. The statistics were chosen by how raw they were. For example, passing yards per attempt is not as raw as passing yards and passing attempts, the two statistics that make it. By using the raw game data, and not season averages or derivative statistics, the model was more flexible and accurate.
In order to parse through the HTML of the websites, a general HTML parser was developed using the BeautifulSoup and HTMLSession libraries. Because the HTML for each website was different, the HTML parser function needed to be adjusted for each case. In general, what the parser did was find the desired stat, and pair it with the team associated with that stat. It did this for every team and every regular season week and then combined all the teams and weeks into a pandas data frame with the rows sorted alphabetically by team name, and the columns sorted from week one to week sixteen. Every stat in the database followed this format to limit mistakes later on in the development of the model.
General Approach
The general approach in the development of the model was to use the averages of the stats through a certain number of weeks to develop a metric that can quantitatively represent a teams ability to make the playoffs. The more weeks of data, the more accurate the model will be, but the goal is to increase the accuracy of the model while decreasing the weeks of data used to train the model.
Development of the "Strength of Team" Metric
The whole model hinges on a single metric called the Strength of Team (SOT). The SOT was developed by trial and error, and the current iteration uses only 12 statistics: 7 offensive, and 5 defensive. All these statistics were combined into a couple of different ratios and exponentially increased. This creates a great spread between the teams whose statistics at first glance don't seem too far off. Once this was done, the metric was passed through a logarithmic function in order to scale it back down to a comprehensible value.
Adjusting the SOT
The SOT metric, on its own, is a value that represents what a team has done so far in the season. To increase the predictive quality of the metric, it was adjusted for how tough a team's opponents have been. The SOT was adjusted by multiplying it by a ratio of a team's Strength of Schedule (SOS) to the league average SOT. The SOS was found by averaging a team's opponents SOT.
Constructing the League
Even though each team now has a value associated with how good they are, the chances for that team to make the playoffs largely depend on the quality of the division they reside in. The league was represented in python by a network of dictionaries that end with a list of teams in each division. A representation of the structure is shown below for more clarity. The blue bubbles represent a "dictionary" data type, and the green bubbles represent a "list" data type.

Choosing the Playoff Teams
There are a couple of ways to make the NFL playoffs. The first way is to be the best team in the division. If the team does not win their division, they can still make one of the two wild card positions for each conference. The wild card teams are determined by looking at the remaining teams in each conference after the division winners have been removed from consideration. The two teams with the best records will make it into the playoffs.
In order to determine the playoff teams, the league dictionary was looped through and the teams in each division were sorted by their adjusted SOT. The top teams in each division were chosen, and the others placed in a list for wild card consideration. The top two teams in each conference were chosen as wild card winners and predicted to make the playoffs.
Results
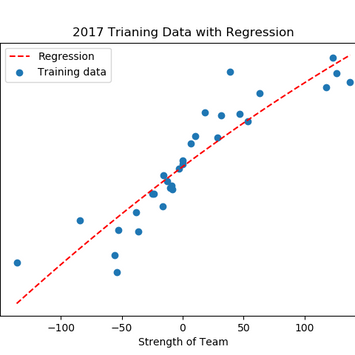
In the current state of the model, the playoff teams were predicted with an accuracy of 72.5%. This is strictly a measurement of how well the predicted teams line up with the actual playoff teams. The accuracy for each of the past 10 seasons is listed below. A way to visualize the predictive capability of the model is by plotting the SOT against the average net points scored in a game. If on average a team is scoring more than their opponents, they should be winning more games, and therefore making the playoffs. The plots for each of the past 10 years can be seen below. The best thing about the model is there is always room for improvement, so as long as the NFL has a season, this model will continue to try and predict it.
2011: 9/12 (75%)
2012: 9/12 (75%)
2013: 9/12 (75%)
2014: 10/12 (83.33%)
2015: 7/12 (58.33%)
2016: 8/12 (66.67%)
2017: 5/12 (41.76%)
2018: 9/12 (75%)
2019: 10/12 (83.33%)
2020: 11/12 (91.67%)

What's Next?
The next stage of the model is to predict the success of a team on a weekly basis. Though a team's average success can be extrapolated from the current model, a team deviates greatly from their average on a week to week basis. To accurately predict a team's weekly success it requires more data manipulation, and precision from the SOT metric.


