
IC Engine Mechanical Efficiency
Overview
The goal for this project was to take the fundamentals of IC engines I have learned through the IC engines course (ME 4011) provided at Georgia Tech and analyze some mass-produced engines made by commonly known companies in hopes of finding a predictable trend in mechanical efficiency. The project consisted of performing a thermodynamic analysis of an Otto cycle, calculating the mechanical efficiency, and then performing a regression on the results.
Assumptions
There are a few assumptions that are being made through the analysis, so before I get into the results, I will present these assumptions and explain the affects they may be having on the results.
Equivalence Ratio
There are 15 parts air needed for every 1-part gas to have a complete combustion process. This is known as the stoichiometric ratio, and even though this ratio is needed for complete combustion, there are some situations where complete combustion does not occur even with the stoichiometric ratio present in the cylinder. For example, this can happen if the engine is running at a speed that does not give the combustion process enough time to be completed. A common way to compensate for this issue is to use an air to fuel ratio that is slightly rich. Therefore, an equivalence ratio of 1.1 was chosen to allow for an increased simulation of power that is estimated to exist where the engines are at peak performance.
Combustion Efficiency
Because the equivalence ratio is greater than 1 we know complete combustion is not occurring. Combustion efficiency of 90% was chosen to account for this in the thermodynamic calculations. According to Pulkrabek [1], the combustion efficiencies for an engine that is working properly will typically range between 95% and 98%. The engines, in this case, were running at high RPMs and being pushed to their limits to find their performance metrics, so a lower efficiency was chosen to account for the decreased time given for the combustion process.
Exhaust Residual
Once the combustion has occurred, the exhaust stroke will do its best to get rid of all the residual leftover in the chamber so there is maximum volume in the cylinder for the air-fuel mixture coming in to start the next cycle. Since this process isn’t perfect there is some residual leftover in the cylinder that takes up the space intended for the new air-fuel mixture. The exhaust residual was estimated to be 6%. This reduces the amount of actual mass capable of being used for combustion in the upcoming cycle which reduces the overall power the engine is capable of producing.
Air-Standard Cycle
The cycle experienced in the cylinder of an IC engine is complex, so to simplify the analysis some assumptions are made about the cycle. How the air-standard cycle differs from an actual cycle is highlighted on pg. 69 of Pulkrabek's Engineering Fundamentals of the Internal Combustion Engine [1].
Engines Analyzed
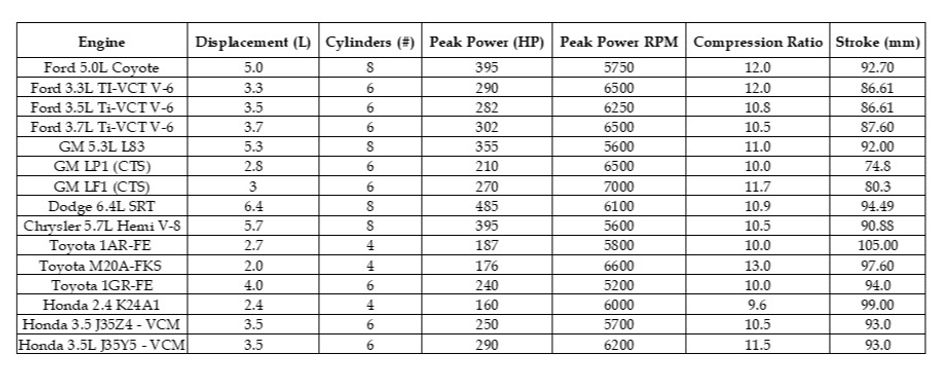
The published engine specifications as well as performance metrics at peak power were used to do the analysis. With the peak brake power known, the mechanical efficiency can be calculated by estimating the peak indicated power through analysis of an Otto cycle. Below are the engines and their data that were used to do the analysis.
Thermodynamic Analysis
The indicated work done by a given engine can be calculated by analyzing an Otto cycle using the data above and the assumptions mentioned earlier. There are 6 stages in the cycle that must be treated with additional assumptions to the ones previously mentioned. The compression and power strokes were both be treated as isentropic processes, and the combustion and exhaust blowdown was assumed as a constant volume process. Because the intake or exhaust valve will be open during either the intake or exhaust strokes, it was assumed that no work was done during these strokes. The ideal gas law was used in various forms to connect the pieces of the cycle and form a cohesive thermodynamic analysis. A constant volume was assumed during combustion and exhaust blowdown, implying that no work was done during these intervals of the cycle and that the NET work of the cycle could be calculated by summing the work done during the compression stroke (which is negative) with the work done during the power stroke. The calculated NET work of the cycle represents the ideal work of the engine assuming no losses.
Mechanical Efficiency
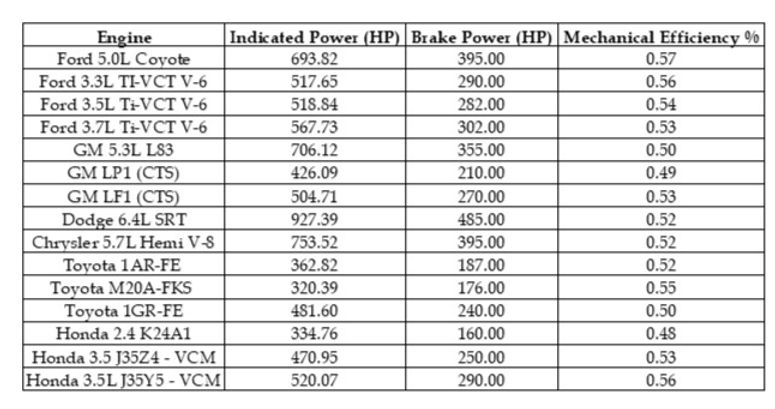
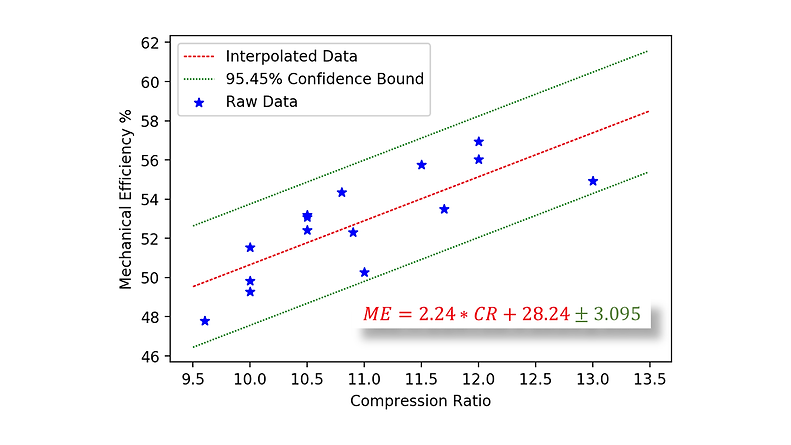
The mechanical efficiency is a ratio of actual power from an engine to indicated power done for that same engine, so once the indicated work was found it could be converted to power using the engines specified RPM, and the mechanical efficiency was then a simple calculation. Once the mechanical efficiencies were calculated for all the engines, they were plotted against their respective compression ratios. This revealed a significant trend in the data. The mechanical efficiency increased with the compression ratio, so a prediction model was developed to capitalize on the data.
Mechanical Efficiency Model
The mechanical efficiency can now be estimated for a given engine, strictly knowing the engine's compression ratio. Below is the regression with 95.45% confidence bounds, as well as the data the regression is reliant on. The plot shows that if we allow around a 3% cushion above and below the prediction line, the model will capture 95.45% of the real data. More precisely, the model is characterized by the equation shown below on the plot. The confidence bounds were determined by multiplying the sample standard deviation by the coverage factor correlated with a 95.45% confidence (K=2) to obtain a confidence interval of 3.095 above and below the predicted value.
Citations
[1] W. W. Pulkrabek, Engineering Fundamentals of the Internal Combustion Engine, 2nd ed. Upper Saddle
River, NJ: Pearson Education International, 2004.